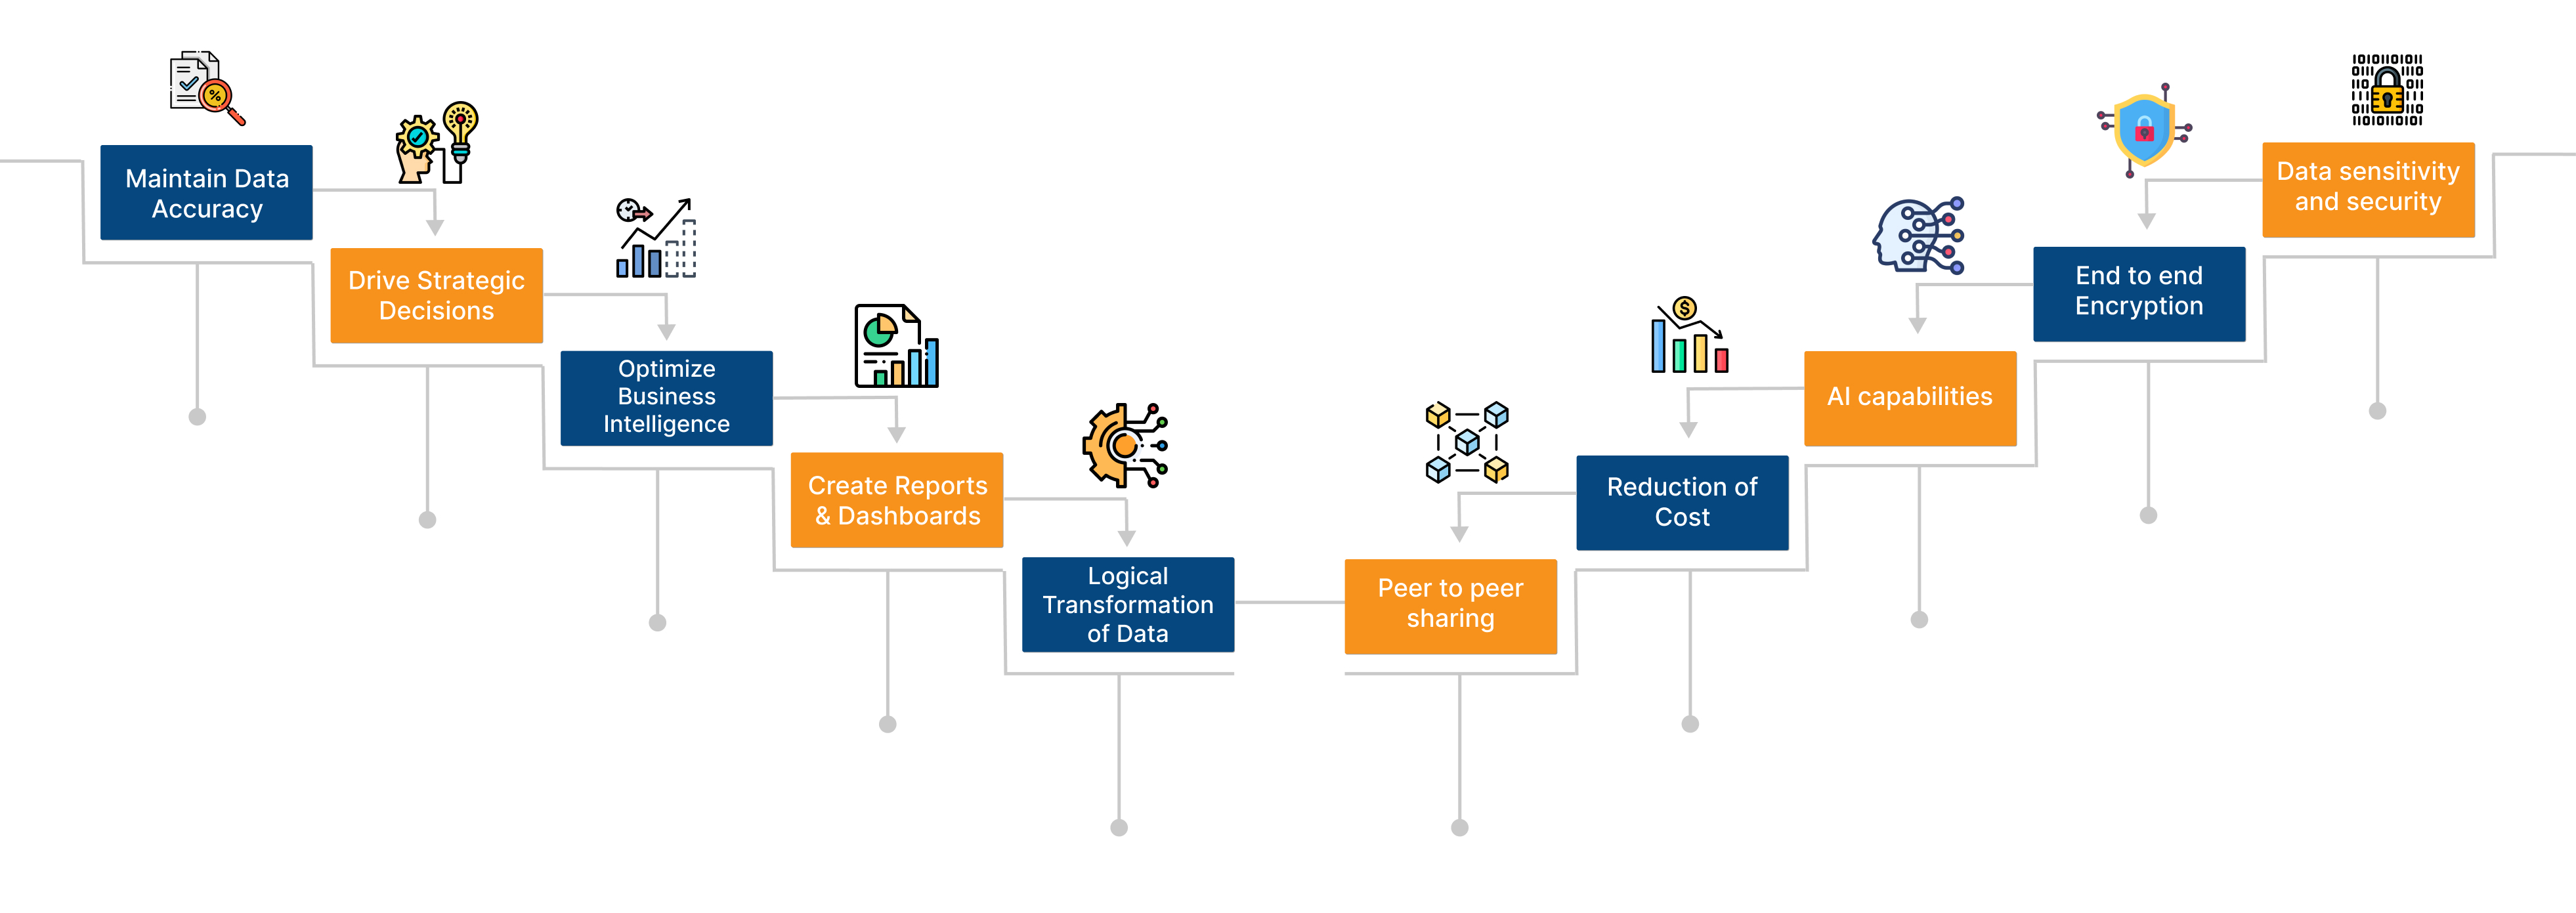
Data Visualization is the presentation of data is a decipherable format thereby increasing its understanding and relevance. This practice is used to translate information into data visuals making it easier for the brain to intercept and implement. Data can be represented as charts, animations, infographics, plots and excel sheets. This requires the fundamental understanding of the meaning of the data so as to interpret and convert it into visuals. Data Visualization is an Idea creation process whereby the representation is aligned to the goals of the stakeholders. Emicon helps in using the Business Intelligence and Data Visualization tools to make it easy for its clients to make decisions related to the data with ease. Its helps in simplifying, structuring, organizing and strategizing complicated data sets.
POWER BI 
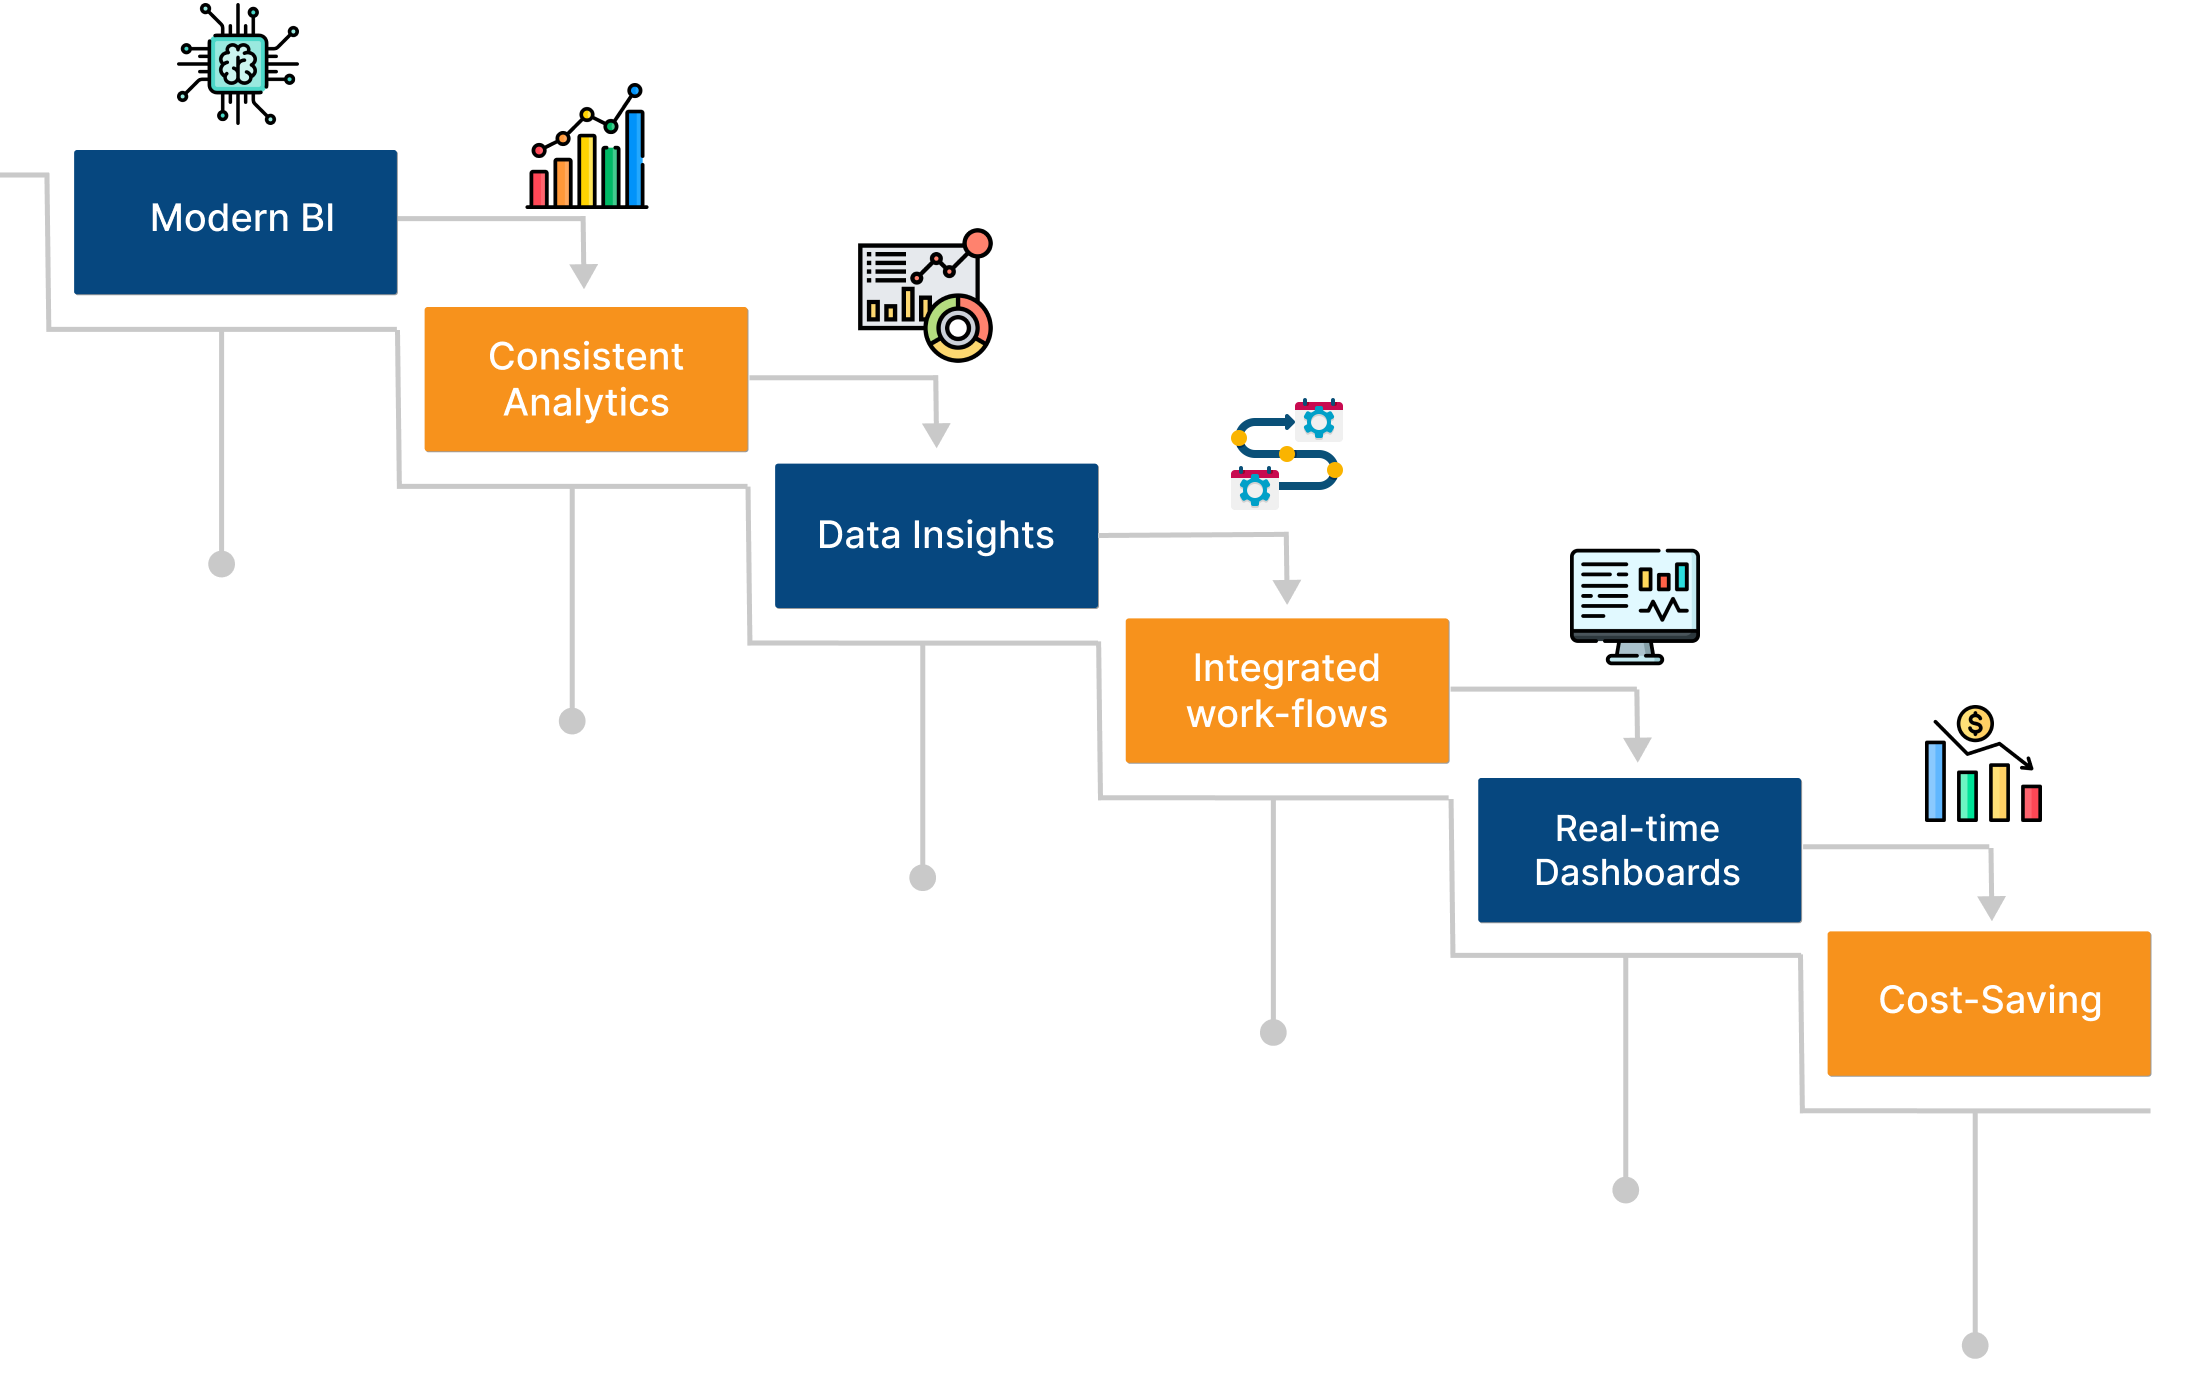
Build a stronger data foundation with Power BI delivering more flexibility with interactive data tools. Microsoft’s Power BI helps in effective data visualization with solid integrations and custom data connectors. The primary focus is on Business Intelligence and increasing efficiency with the same. Power BI stands out due to its basic ability to organize, structure and represent data in a more simplified way. Use Power BI to create Dashboards, reports, visualizations to ease the ability of taking intelligent decisions.
GOOGLE CLOUD LOOKER 
Google Cloud Looker is a Business Intelligence platform with embedded data analytics and data applications to explore and organize data and its insights. Google Cloud Looker helps unleash the true potential of your data making it smarter and simpler to understand. It drives better outcomes and improves data driven experiences. Looker helps create dashboards and reliable data decisions. It empowers and unifies the teams to work uniformly on common data attributes to take informed data decisions.


TABLEAU 
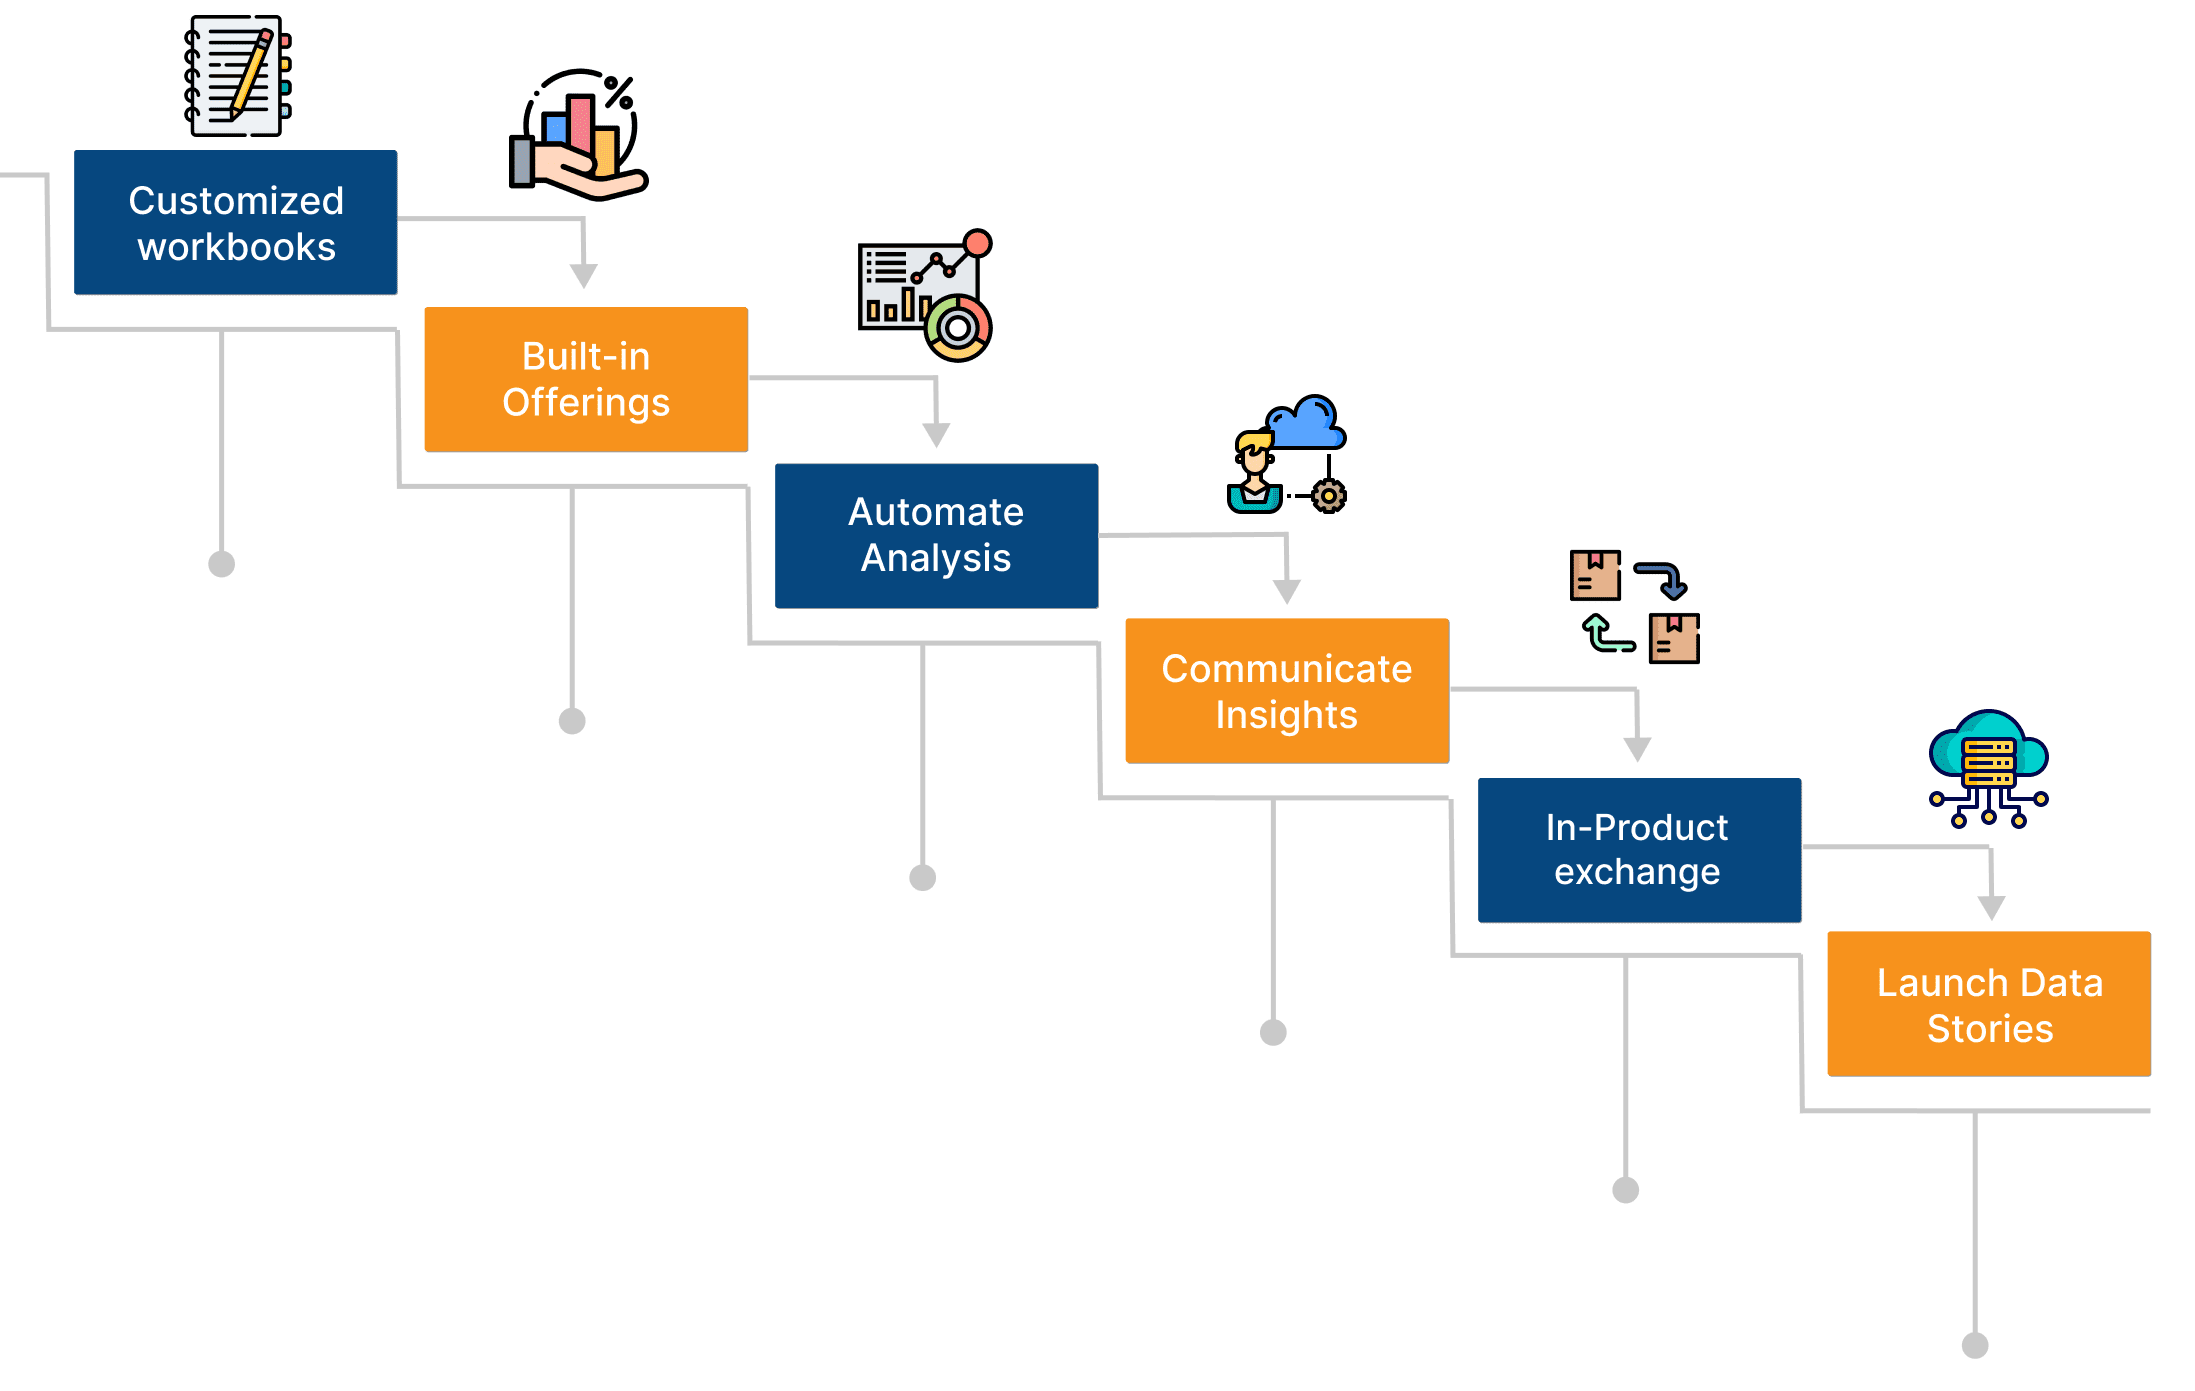
Tableau creates data stories thereby making everyone understand data. It helps analyze, communicate and build plain language illustrations. These data interpretations are tailor-made and customized to embed and apply positive and negative changes to the core data. The dashboards are powerful, interactive, accessible and operational. Tableau accelerates the utilization of data henceforth ensuring prudent data backed decisions.


